Compare and contrast Type 1 and Type 2 diabetes
Activity 2.1.1 Diagnosing Diabetes

This artifact includes a venn diagram of comparing the two types of diabetes. It shows how type 1 and type 2 are different and the same. It includes the definition, symptoms, and types of treatment of each one. At the beginning of the year, I did not know a lot about diabetes and how it works. I didn't know about the two different types and how they're different and similar. I feel comfortable discussing the topic of diabetes now.
Diagram the feedback relationship of blood glucose and hormones insulin and glucagon.
Activity 2.1.3 Feedback
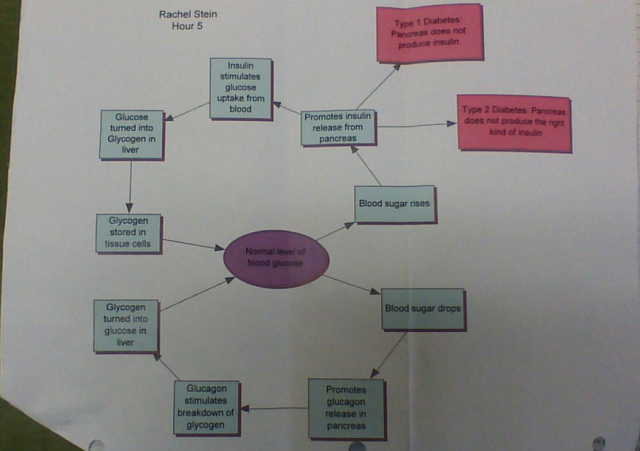
This artifact shows the relationship between glucose and glucagon in the body. It shows how the body would react if the blood sugar level would rise or drop. At the beginning of the year, I didn't know anything about feedback responses. I knew about glucose but I didn't know the relationship between glucose and glucagon. I grew from not knowing anything about feedback responses to making diagrams about them. I also made a diagram showing the feedback responses if the body temperature would rise or drop.
Demonstrate the process of dehydration synthesis and hydrolysis
Activity 2.2.3 The Biochemistry of Food

This artifact shows the definition of dehydration synthesis and hydrolysis. It also shows the process at the molecular level. At the beginning of the year, I didn't know anything about dehydration synthesis and hydrolysis in the body. This artifact shows the process but without moving pieces. The drawing of the process its not very big.
Recognize that the structure of macromolecules is related to their functions in the human body
Activity 2.2.3 The Biochemistry of Food

This artifact shows what different macromolecules are composed of and what they do in the human body. It also had food examples from Anna's diet to help find out how she died. At the beginning of the year, I didn't know that Carbohydrates, Proteins, Lipids, and Nucleic Acids were macromolecules and that they were made of smaller things. I also did not know anything about monosaccharaides or monomers. I know so much more about the biochemistry of food.
Describe the structure of DNA including its specific monomers.
Activity 1.2.1: What is DNA?
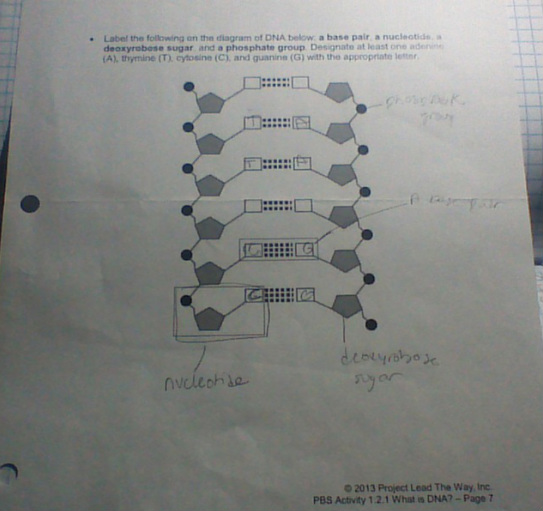
This artifact shows the structure of DNA and its different parts. The picture shows that DNA is made up of nucleotides which are made up of a deoxyribose sugar and a nitrogenous base. It also shows the base pairs that make up DNA. At the beginning of the year, I had a basic understanding of DNA and the base pairs. Now I know much more about the structure of DNA and its monomers.
Demonstrate how sickle-shaped red blood cells lead to decreased oxygen flow to body tissues.
Activity 3.1.1 Blood Detectives
Activity 3.1.2 Sickle Cell Diaries
Activity 3.2..2 The Genetic Code
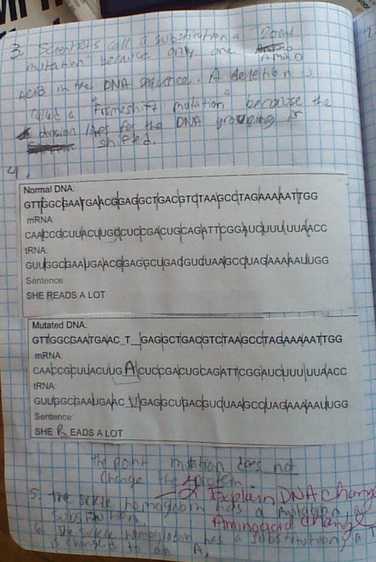
Activity 3.2.3 Does changing one nucleotide make a big difference?

These artifacts demonstrate how sickle-shaped RBC's lead to decreased oxygen flow to body tissues. "Blood Detectives" compares normal RBC's and sickle-shaped cells and explain Anna's symptoms while she had sickle cell disease. "Sickle Cell Diaries" shows Anna's symptoms of sickle cell disease throughout her life time and how she dealt with the disease. "The Genetic Code" shows how the genetic structure to make the hemoglobin was changed in Anna's DNA, resulting in sickle-shaped RBC's. "Changing one nucleotide" shows where the sickle shape of the cell comes from and the different amino acids that were changed. I did not know much about sickle cell disease/ anemia before this unit.
Model the inheritance of genetic diseases
Activity 3.3.1 How is DNA passed through the generations?
Activity 3.3.2 Chromosomes- A Closer Look
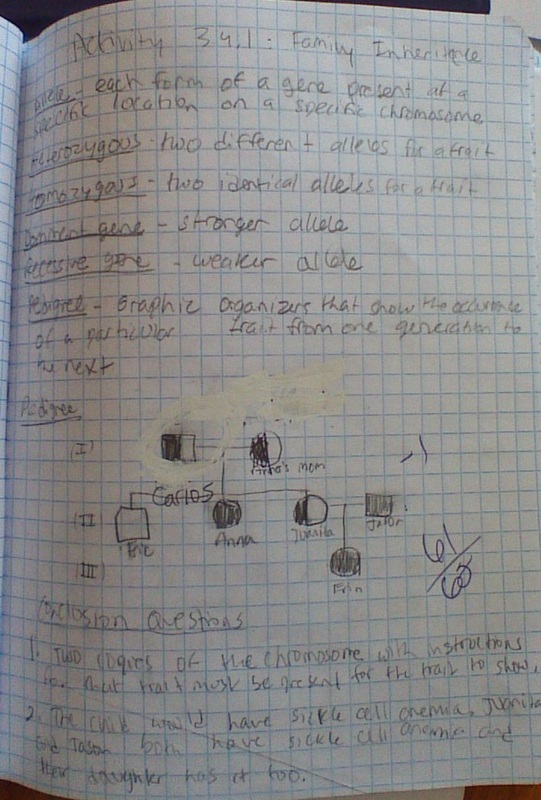
Activity 3.4.1 Family Inheritance
Activity 3.4.2 What is the Probability?
These artifacts model the inheritance of genetic diseases. Activity 3.3.1 shows how certain traits are passed along on genes after mitosis and mitosis. Activity 3.3.2 shows how different chromosomes affect what kind of genetic diseases an individual may have. Activity 3.4.1 shows how a dominant gene is passed along and shows up in a family's pedigree. Activity 3.4.2 shows this as well but also demonstrates the probability of one's chances of getting a disease through Punnett squares. The results of the Punnett square are then used to make the family's pedigree.
Identify the main structures in the heart and describe the functions.
Activity 4.1.1 Path of Blood in the Heart
Activity 4.1.2 Anatomy of the Heart
These artifacts identifies the main structures of the heart and describes their functions. Activity 4.1.1 analyzed structures that contribute to the path of the blood flow through the heart, lungs, and body. It states the steps needed for the structures of the heart to properly get oxygenated blood to the body and deoxygenated blood to the lungs. Activity 4.1.2 provided a more in depth look at the heart's structures and functions through a dissection. Before this unit, I knew very little about the structures and how they pump blood through the heart. I feel I have a much better understanding of the heart and feel comfortable about showing my knowledge.
Describe the prevention of and treatment for various infectious
5.1.2 Infectious Disease Agents
The artifact demonstrates the objective by organizing the types of infectious disease with their characteristics. Characteristics include disease examples, modes of transmission, host requirement, and treatment of the agent. Included in the conclusion questions were ways to prevent the transmission of each infectious agent. At the start of this unit, I only knew basic information on how bacteria and viruses can make people sick. I did not know a lot of information on how fungus, protozoan, helminthes, and prions make people sick. I now know so much more about the various types of infectious agents.
